Leading a sales force team to deliver profitable revenue growth in today’s complex business environment is a big challenge. Not so long ago, when making critical sales force decisions, sales leader relied primarily on their own judgment and experience, as well as on input from field sales managers and sales people. Today, sales leaders need to do more. A perfect storm of data, technology, and analytic innovation is radically changing the dynamics of sales force management and allowing leaders to gain new insights for driving sales force success.
Business Analytics: A Powerful Tool
To compete more effectively, company needs certain capabilities – a set of people and competencies, process data, and tools for using analytics and decision frameworks to support sales force needs, diagnose problems and opportunities and design solutions for major sales force decisions.
Frequently, when people think about using analytics in a sales force, they think about customer analytics – using data about buyer needs and behaviors to prioritize customers, develop customized offerings, and create sales. As important as customer analytics are. There are various sales force decisions that can have benefit from the power of analytics. Sales force members, ranging from top leadership to first line sales managers to frontline sales people, all have questions that analytics can help address.
The analytics tool helps to create reports which can be helpful to people of different designations in different way.
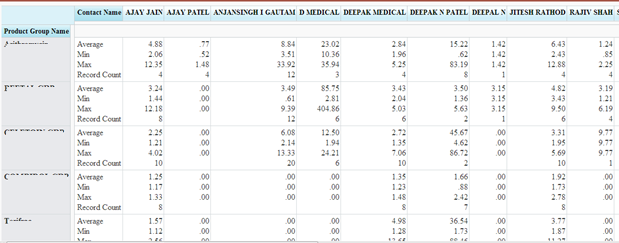
For example: Product Manager would like to see the sales of products whereas the line manager would be interested in looking at the effectiveness of his subordinates
The analytics tool can help you to design the reports as per the requirements by different level of sales people.
These reports can be saved and referred to whenever and wherever needed. Some of the features of the analytics tool are
1. Reports with complete customization
2. Supports multiple formats for the report – Tabular, Summary and Matrix
3. Ability to create customizable charts
4. Filtering of data based on different criteria’s
5. Create and apply formulas